
Waking up to the noise of the rolling waves of the Atlantic meeting the shore of Sesimbra bay is not a bad way to start a Monday.
This week, the BalticSeaWeed blog attends the ECSA54 conference in the lovely seaside town of Sesimbra, on the southern coast of Portugal. What a wonderful venue for a marine conference, indeed. Even though we spend most of the time indoors, it’s still nice to know that outdoors there is a sunny 20 degrees C waiting for you.
ECSA stands for Estuarine and Coastal Science Association, and is closely linked to the Elsevier scientific journal Estuarine, Coastal & Shelf Science, which publishes the papers from the conference in a special issue each year.
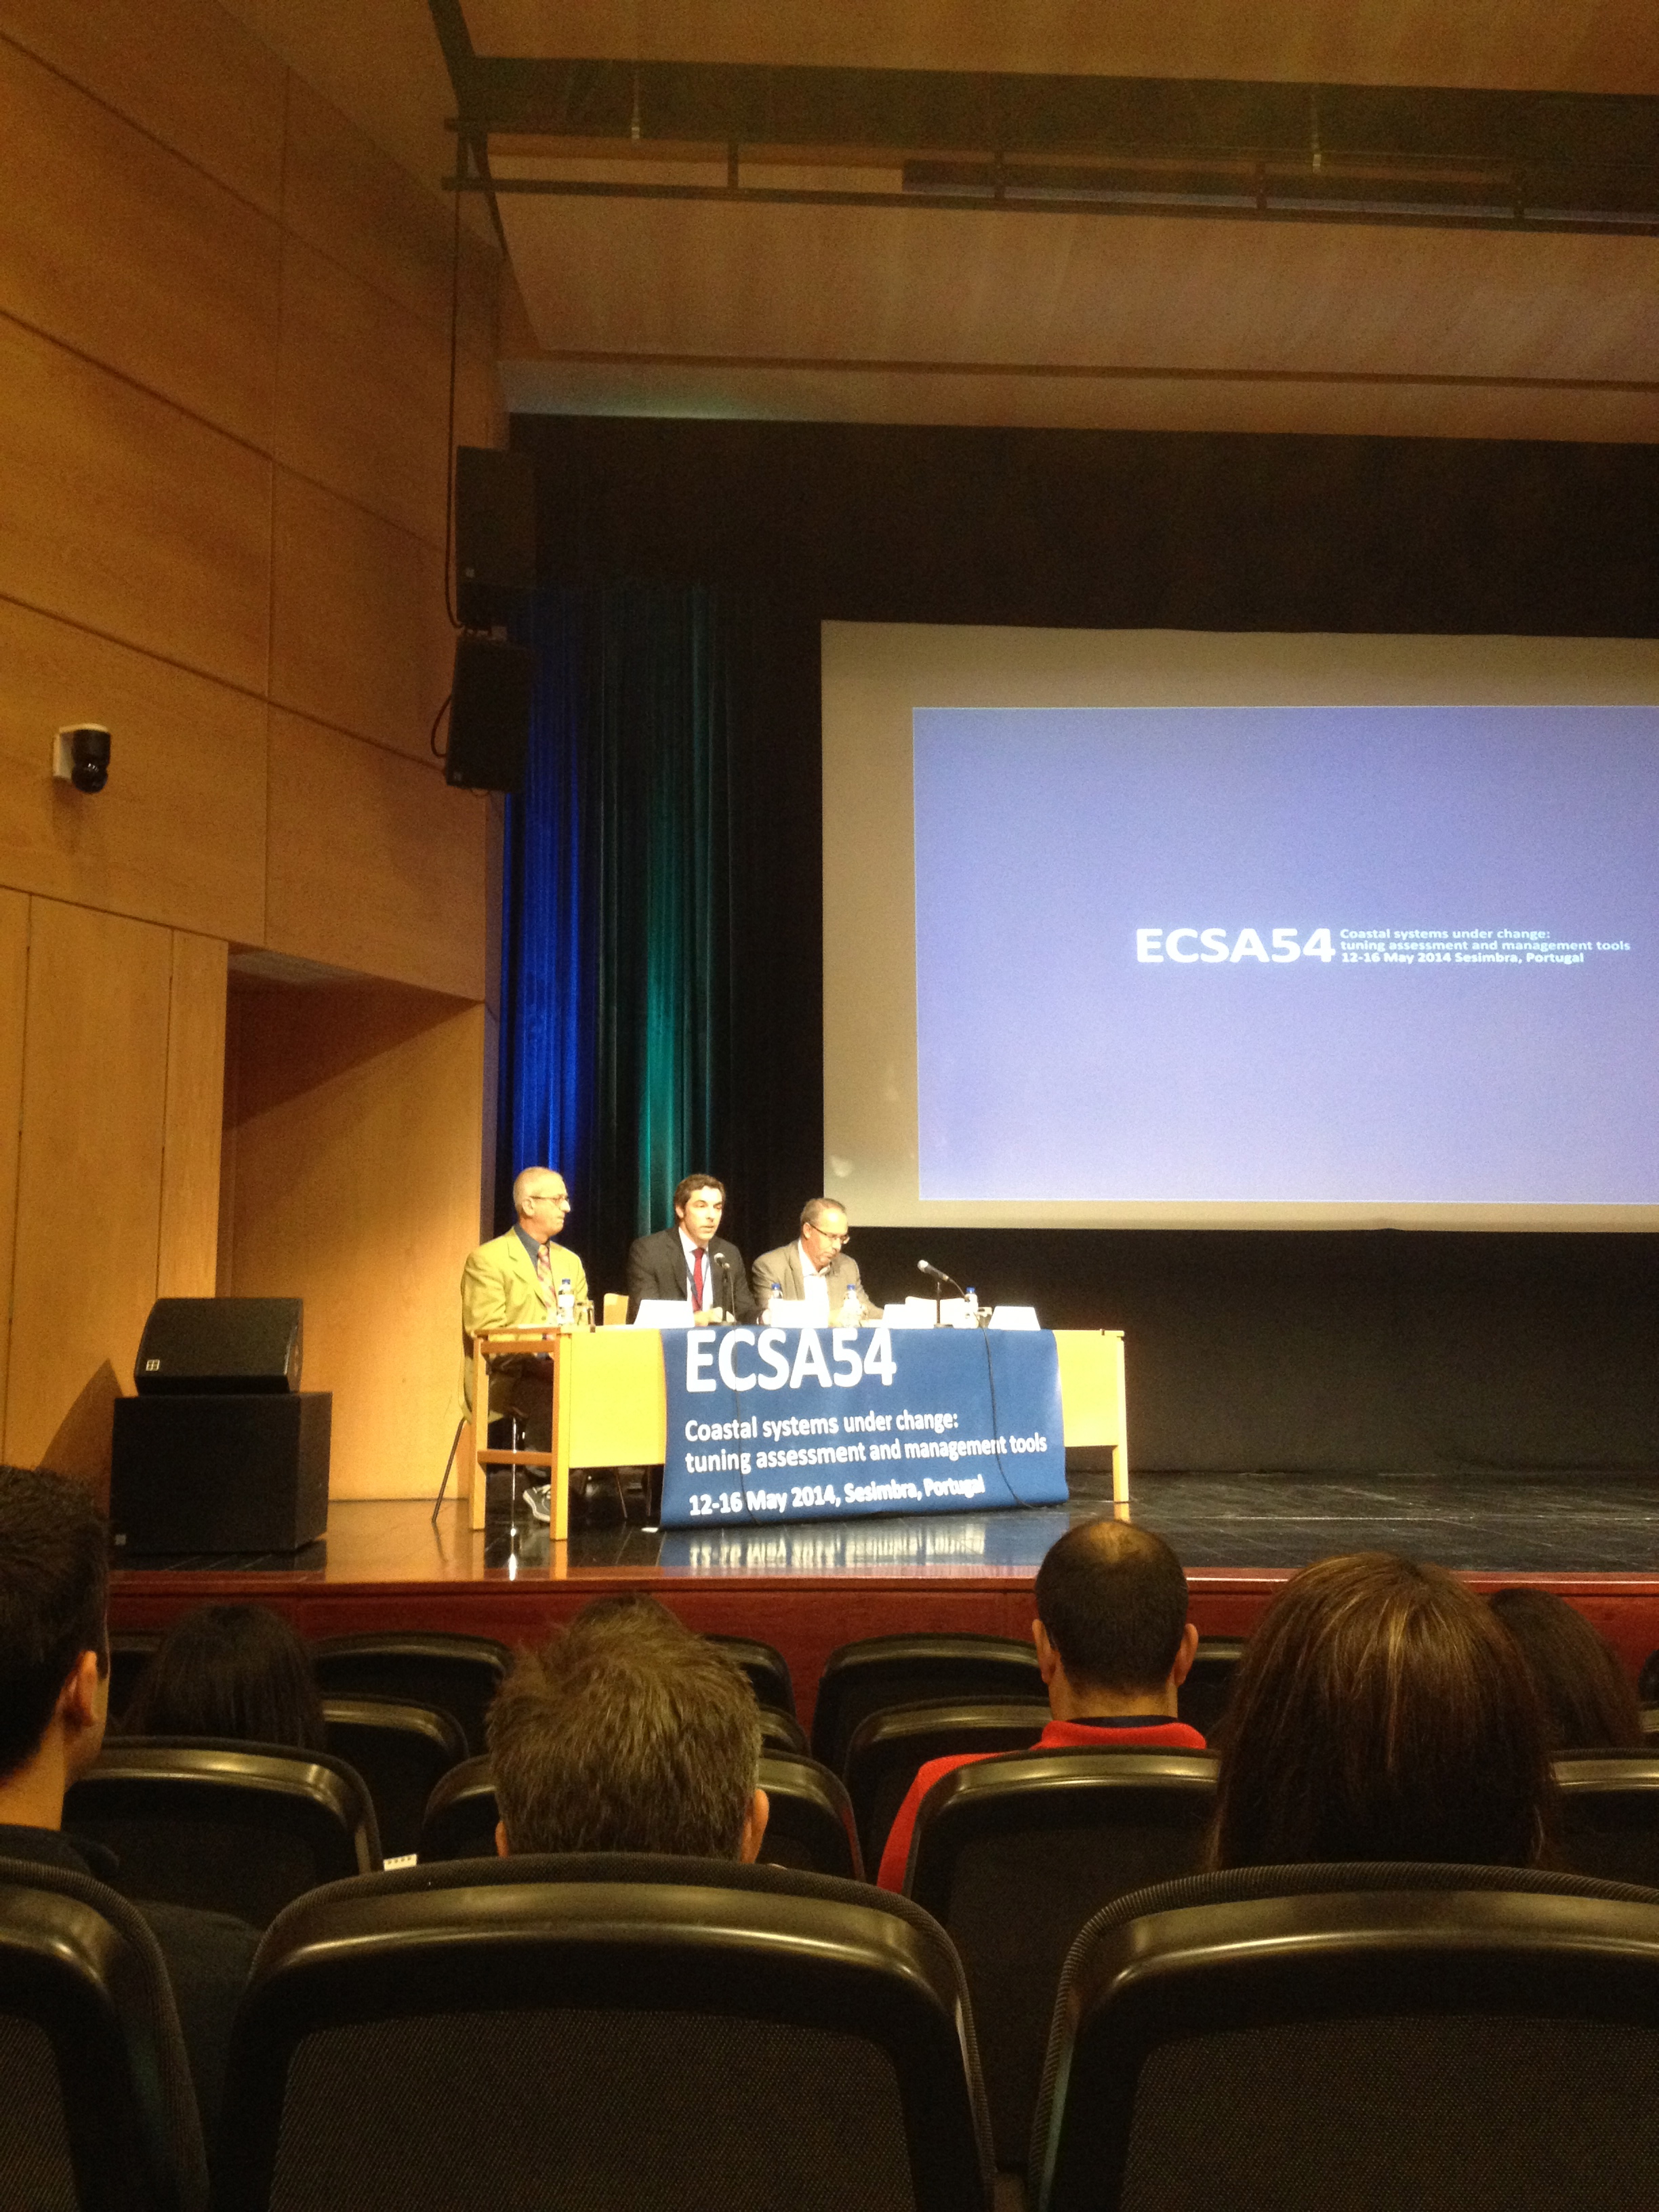 The welcome comittee
We start the conference by the mandatory opening session with information, thanks to the sponsors, organizers and welcome by the Sesimbra mayor. There are 250 participants from more than 40 countries, which is a really good scope.
The first topic for the conference today is “Shifts in biodiversity and ecosystem functioning” which is opened by keynote speaker Anne Magurran from St Andrews University, Scotland. We are happy to see that of the invited speakers, there are more women than men. A first for me, hoping this positive trend will last. Anne takes us from Darwin and his observations of species richness and abundance and explains how ecological communities’ richness changes over time. She uses a data set from the Bristol Channel as an example, where scientists have sampled fish in the water intake mesh to a power station every month for 33 years! What a data set! (If you want to read some nice fish papers, look for Magurran & Hendersson 2003 Nature, 2011 Phil. Trans. or 2012 PRSB, and Shimadxu et al 2013 BMC Biology).
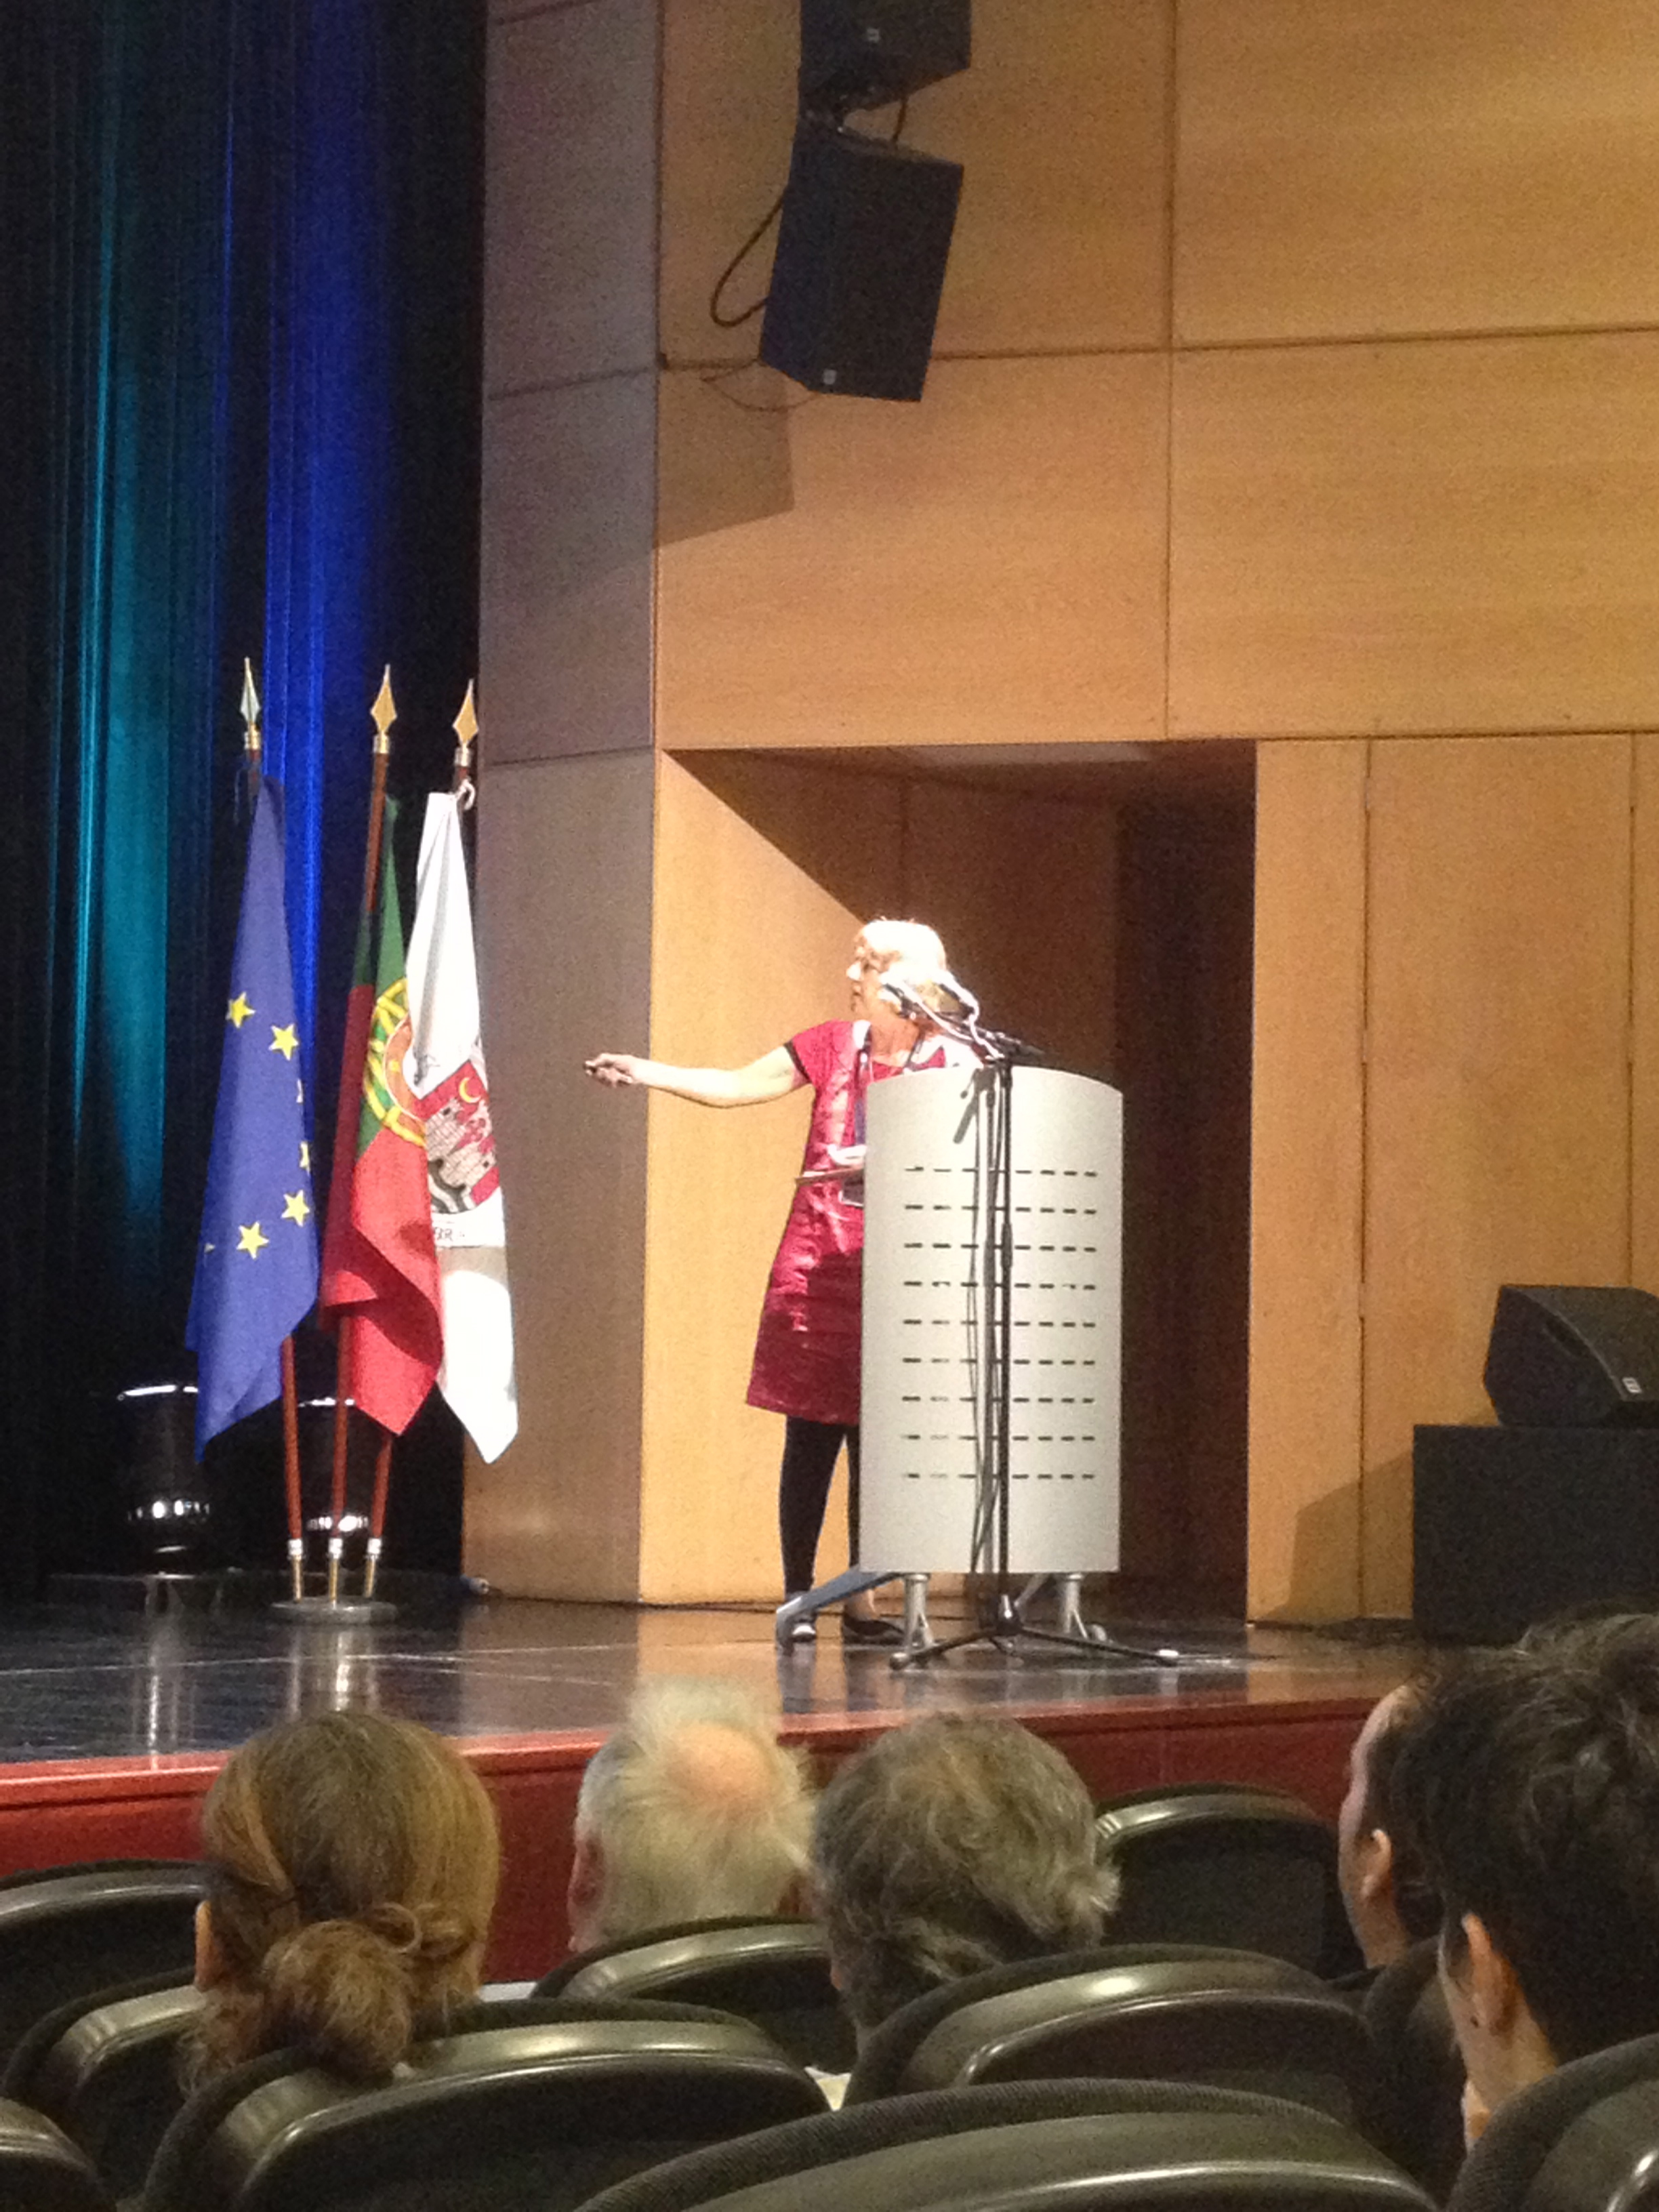 Anne Magurran shows interesting and thoughtprovoking data
This data set really provides good background for community modelling, which will come up in the program several times during the week. I will be interesting to see if anyone has as good a background data as this. After showing the natural changes in the system, Anne moves on to speculate on how much chance is caused by human impact. She concludes that the consequences for ecosystem functioning is yet to be understood, and this should be a future area of research.
After this very inspiring talk, we move on to three fish presentations. First out is Felipe Martinho from Portugal, presenting “How well do fish community-based measures of ecological quality track change over time? The role of anthropogenic vs climate-driven pressures.” He and his research group have made an Anthropogenic Pressure Index (API) and tested it on local data from 2003 an forward. He presents a decreasing trend in anthropogenic pressure for their estuary, which is nice to see for a change, also that 2006 was a dip in diversity. It would be very interesting to see if this dip can be seen at a larger scale. He ends by pointing out the need for data, and to point out that some pressures will not be measured if they do not significantly affect the biota due to, for example, too low levels.
Prabath Jayasinghe from University of Cadiz, Spain, presents “Links between descriptors of good environmental status (GEnS): Commercial fisheries and marine biodiversity”. The goal of the European Marine Framework Directive is to maintain a good environmental status through high biodiversity. So, what are the pressures from commercial species fisheries on marine biodiversity? This is actually not very well known. Dismantling all the different factors used by the DPSIR Framework to analyze the impact of commercial fishing, and where their data comes from, we see that there are gaps, and quite large ones, too.
Some of the major points are the impacts of bottom dredging and trawling, which destroys so much more than just what they are after, the destruction of macrophytes, which are important nurseries, and several depressing numbers (and photos) on the amount of turtles (60. 000 die each year in ghost nets in the Mediterranean Sea alone), sharks and sea birds that fall victim to long lines, nets and other plastic debris. We need to define which pressures we can do something about, and do it!
Last out before coffee is Rita Vascaconselos from Portugal, presenting her work on “Worldwide patterns of fish species richness in estuaries: Investigating the effects of spatial scale”. Estuarine environments have less species than the adjacent marine environments, and have the gradient from freshwater to marine waters (ecotone/ecocline). Rita has compared data from 130 estuaries around the world, based on ecological realm (salinity) within the estuary, between continents, water temperature and precipitation (which is a factor that has a much larger impact on estuaries than marine environments and must not be forgotten). The take home message is the overwhelming importance of considering different spatial scales and biogeography to quantify important predictor variables.
After discovering that coffee in Portugal means lunch (with meat pies and sweet cakes) and the coffee is made cup by cup by a barrista (oh joy), we trotted down the narrow sunny street to the smaller venue for next session.
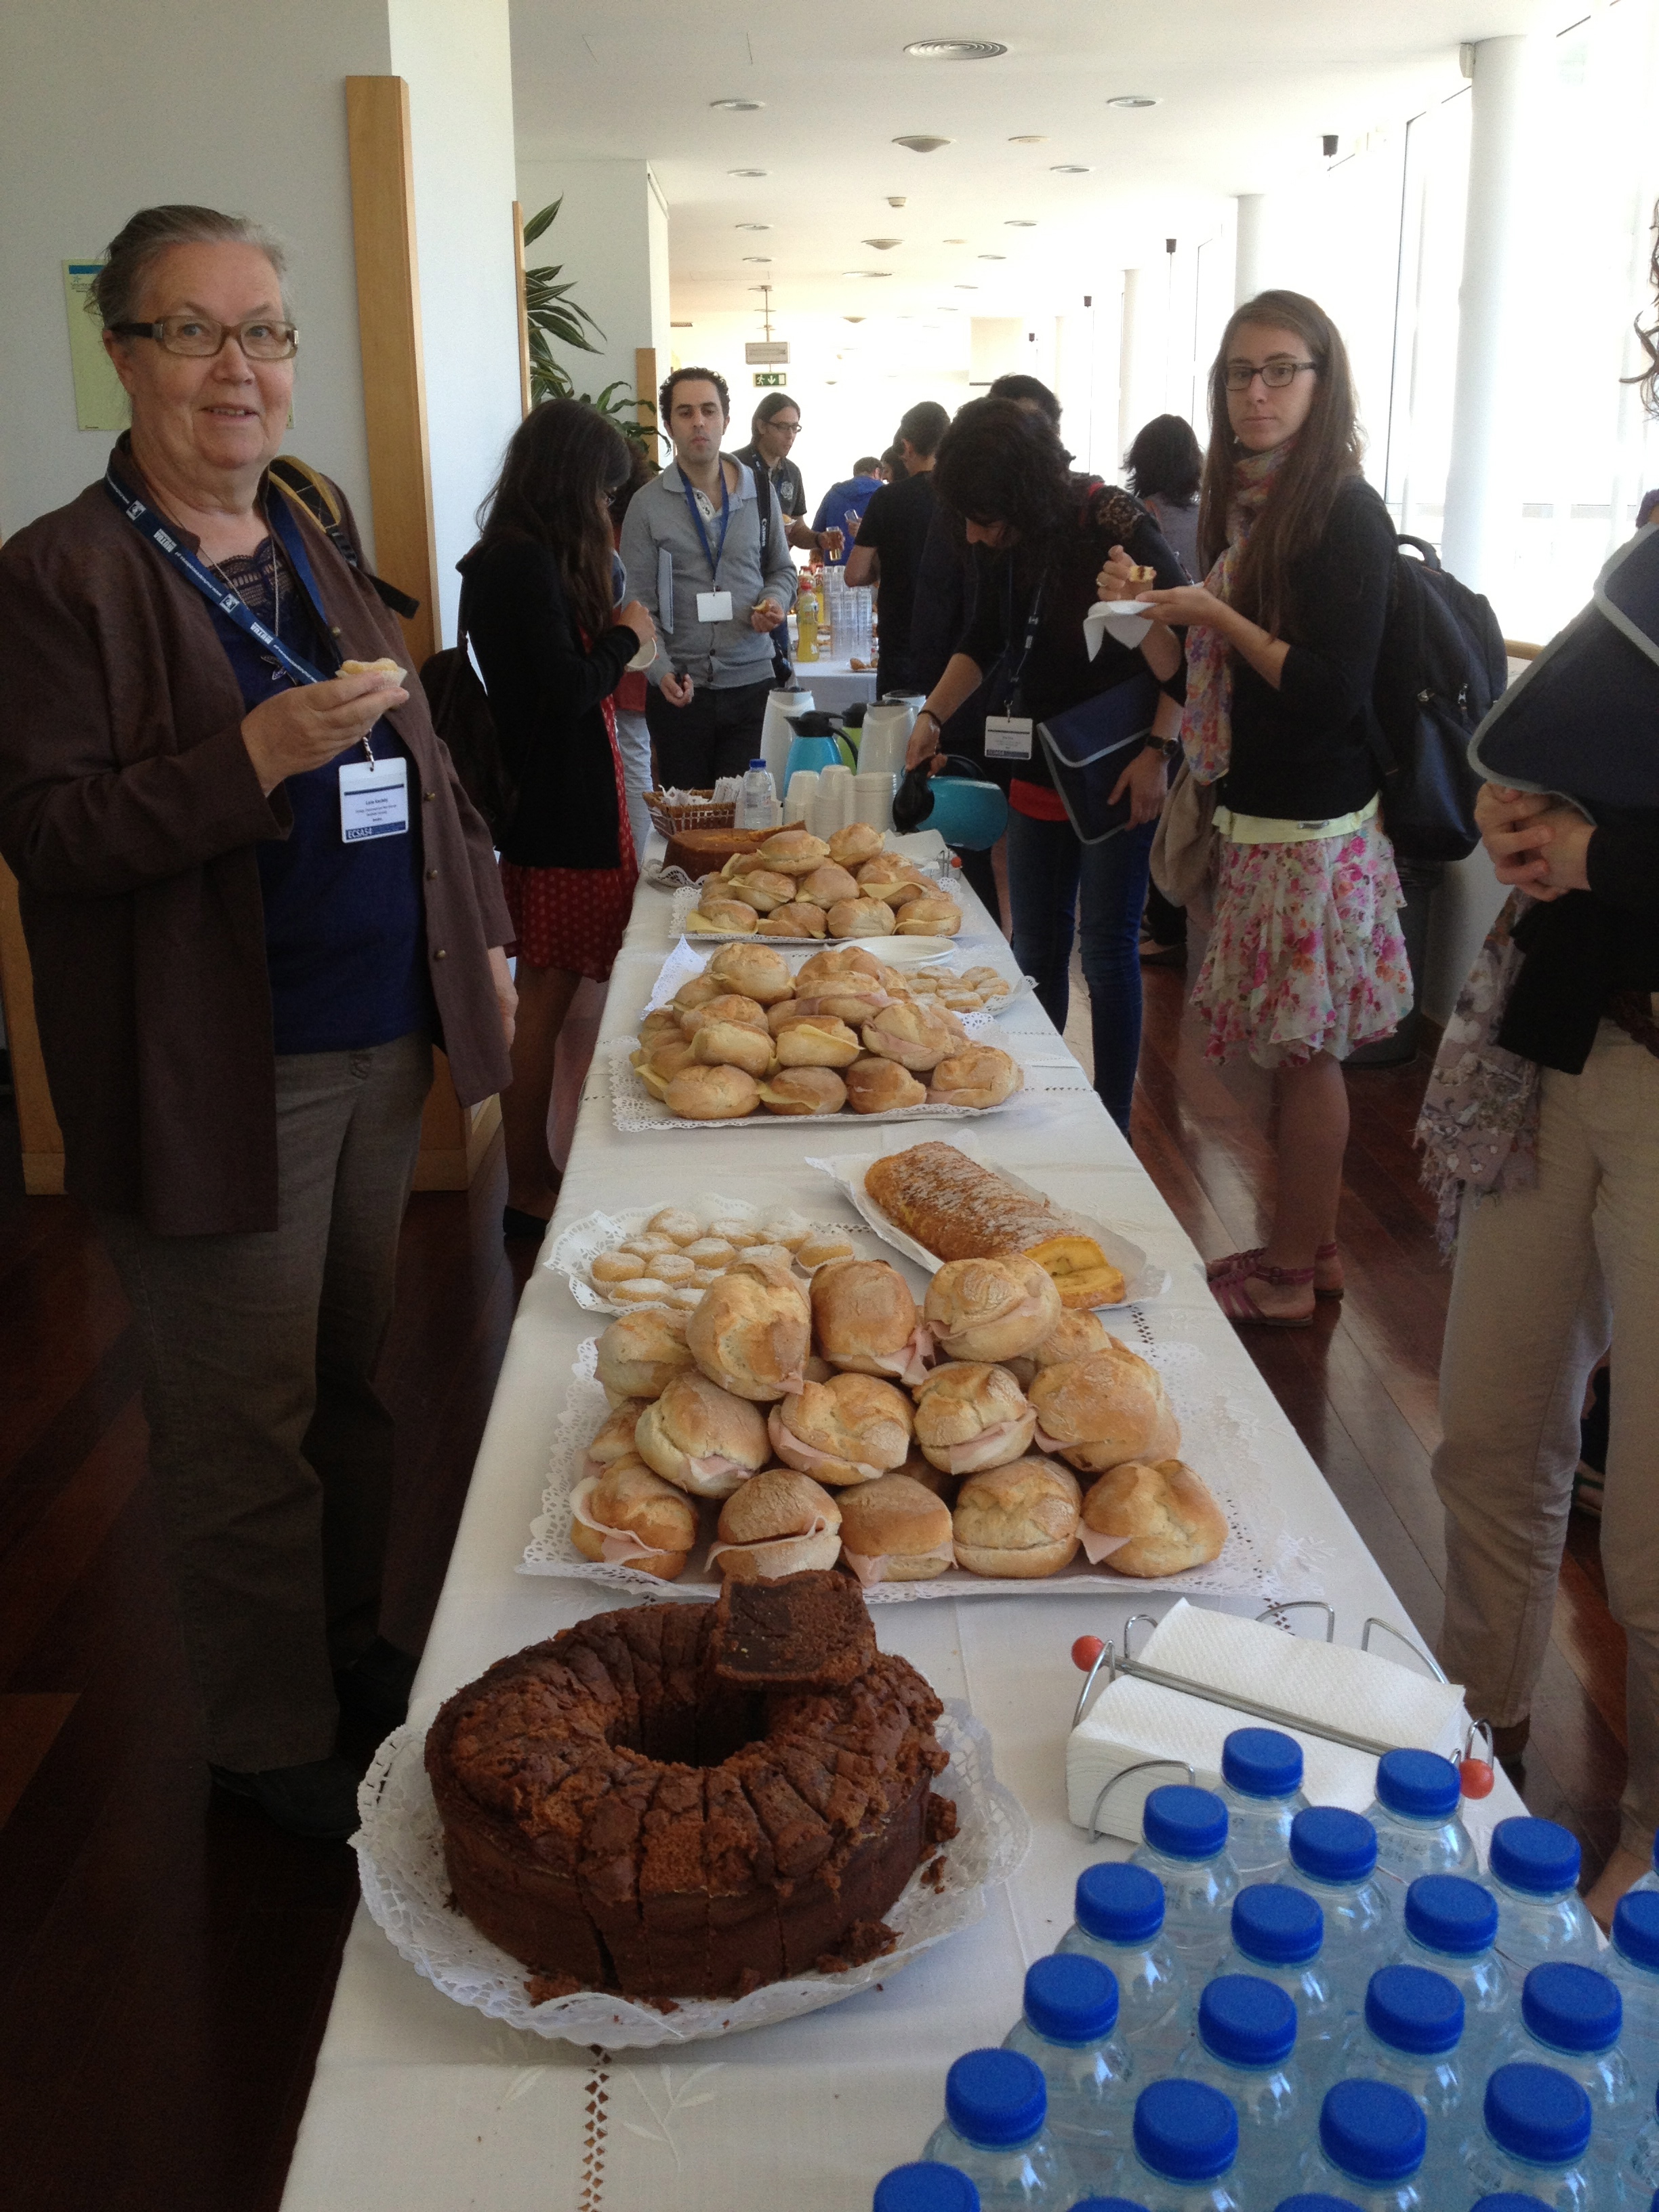 Nice and sugary! But where is the coffee?
JN Franco showed how the kelp Laminaria ochroleuca has decreased in distribution and abundance along the Portuguese coast, and presented his research on the top down (grazing) and bottom up (nutrients) effects that might cause this. Also, the effect of high temperature on growth was tested.
Copper in the sea is both of man made and natural origin, but is toxic in the ppb (parts per billion) for some organisms. E Davarpanah have tested if the micro plastic particles that are littering the oceans, in any way change the toxicity of copper on marine organisms. The results show that micro plastics are having large effects on whole ecosystems, and although the tested concentrations were low, there are toxicological interactions.
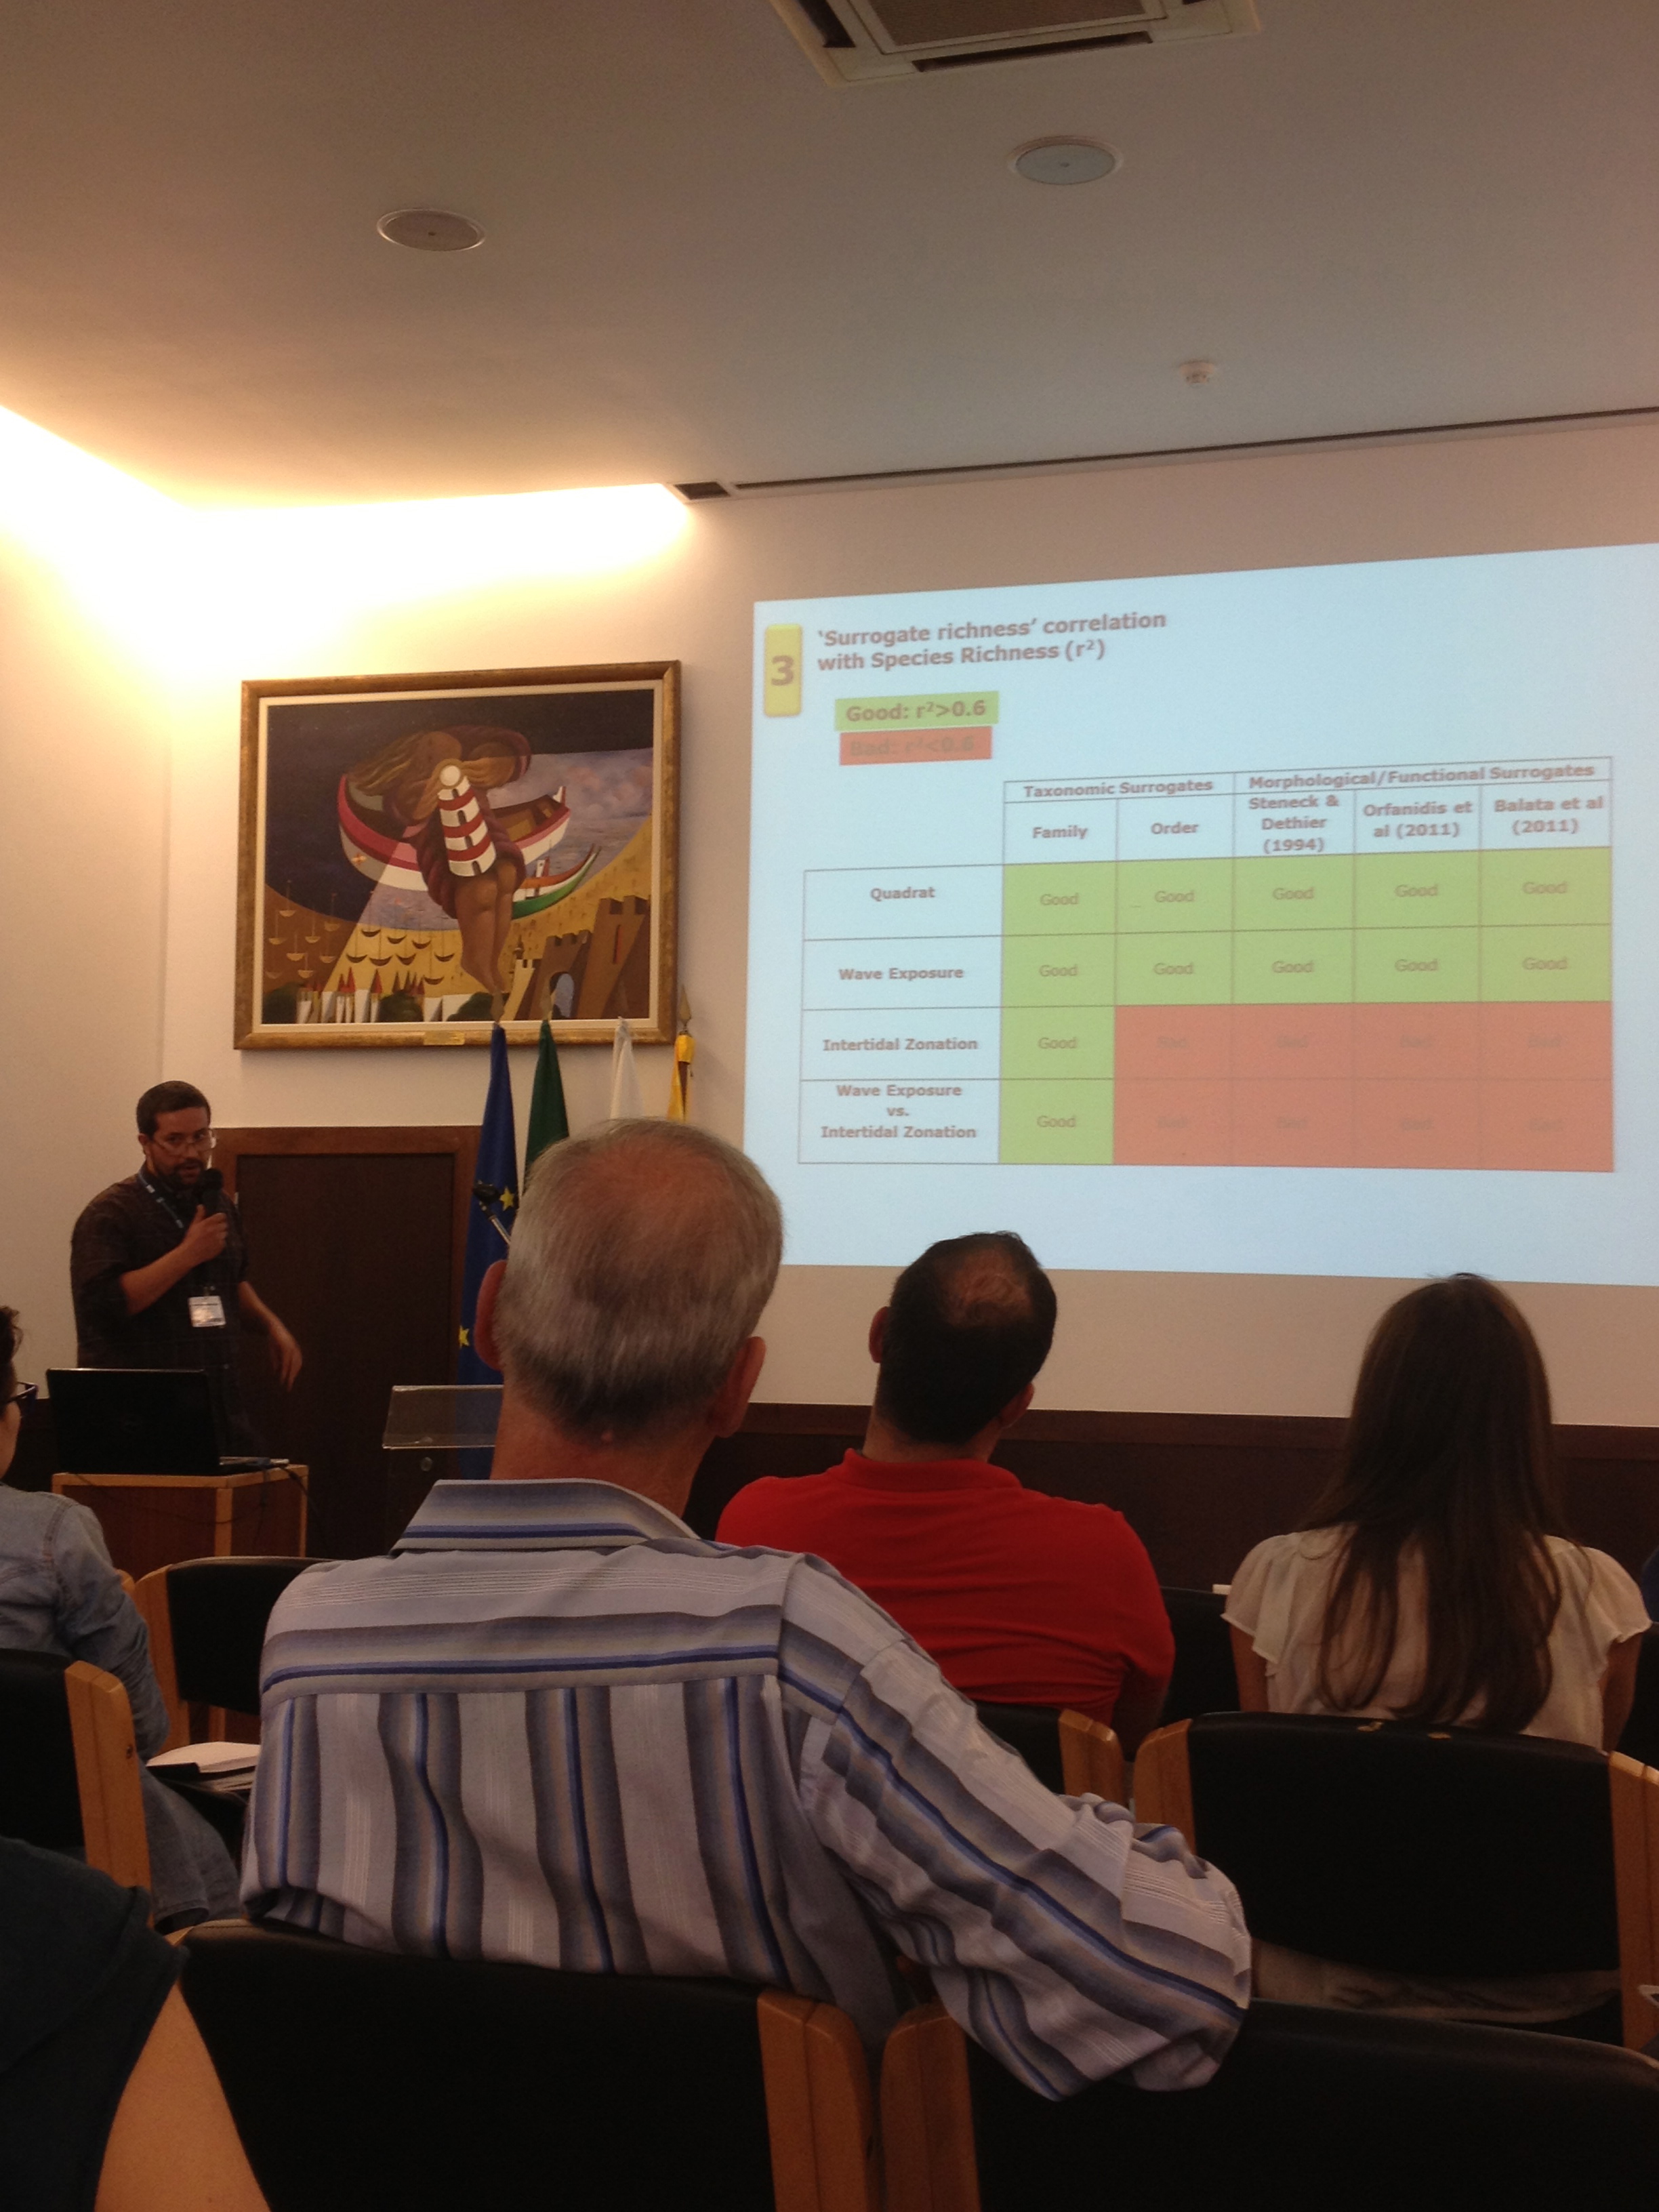 A comparison of models
Rui Gaspar finishes the kelp session with “The use of biodiversity surrogates to describe intertidal macroalgae patterns at small spatial and temporal scales”. The idea is to reduce costs and the need for taxonomic expertise in species rich surveys, previously elaborated upon by Steneck and Dethier 1994, Orfanidis et al 2011, Balata et al 2011 and Smale 2010, and find surrogates that are more easily monitored. Surveys were made, using 50×50 grids on transects through gradients. Each grid was photographed and fed into GIS to get % cover and mean cover per species. Comparing this model to previous ones, this one seems to have a much better resolution as a taxonomic surrogate for family, but not order, and the is not as effective as the model by Seneck and Dethier, so, all in all, maybe one should focus less on time-is-money and just get down and do the work?
With more than 2 hours until next session, and not really hungry for lunch, there was only one thing to do.
 Another Monday at work